scverse interoperability
[1]:
from warnings import filterwarnings
[2]:
filterwarnings("ignore", category=UserWarning)
filterwarnings("ignore", category=FutureWarning)
Please install squidpy and its dependencies as well for this tutorial. Refer to its installation guide, should the following not work: pip install --upgrade squidpy "dask[dataframe]"
[3]:
import numpy as np
import pandas as pd
import squidpy as sq
from skimage.transform import downscale_local_mean

import spatiomic as so
Data loading
[4]:
image_id = "245 g1"
[5]:
# read the image and convert the dimension order to XYC/channel-last
img_data = so.data.read().read_tiff(
    f"./data/mouse_cgn/{image_id}.tif",
    input_dimension_order="CYX",
)
img_data = downscale_local_mean(img_data, (4, 4, 1))

# load the clustered image
clustered_img = np.load(f"./data/mouse_cgn/{image_id}-labelled.npy")

# load the channel list
channels = list(pd.read_csv("./data/mouse_cgn/channel_names.csv", header=0).T.to_numpy()[0])

img_data.shape, clustered_img.shape
[5]:
((438, 438, 35), (438, 438))
Identify spatial neighbors
[6]:
neighborhood_offset = so.spatial.neighborhood_offset(
    neighborhood_type="queen",
    order=1,
    exclude_inner_order=0,
)
[7]:
spatial_weights = so.spatial.spatial_weights(
    data_shape=img_data.shape[:2],
    neighborhood_offset=neighborhood_offset,
)
Creating spatial weights for each offset: 100%|██████████| 8/8 [00:00<00:00, 1409.44it/s]
Convert to AnnData
[8]:
adata = so.data.anndata_from_array(
    img_data,
    channel_names=channels,
    clusters=clustered_img,
    spatial_weights=spatial_weights,
)
[9]:
colormap = so.plot.colormap(
    color_count=np.max(clustered_img) + 1,
    flavor="glasbey",
    color_override={
        1: "#000000",
    },
)
adata.uns["cluster_colors"] = colormap
Use AnnData with spatiomic
Many commonly used spatiomic methods also support AnnData objects. You can specify where spatiomic should look for input data by passing the extra argument input_attribute, input_obs, input_obsm, etc. to the method. Similarly, if you want to decide where the output should be stored, you can use keyword arguments like output_attribute, output_obs, output_uns, etc. Note that the AnnData object is modified in place and the standard spatiomic output is
returned.
[10]:
zscorer = so.process.zscore()

# This will return the standard ND-array but also update the `adata` object in place and add the X_zscored layer
zscored_values = zscorer.fit_transform(adata)
type(zscored_values), adata
[10]:
(numpy.ndarray,
 AnnData object with n_obs × n_vars = 191844 × 35
     obs: 'clusters'
     uns: 'cluster_colors'
     obsm: 'spatial'
     layers: 'X_zscored'
     obsp: 'spatial_connectivities')
Methods that currently support AnnData objects include:
spatiomic.cluster.agglomerativespatiomic.cluster.kmeansspatiomic.cluster.leidenspatiomic.data.subsamplespatiomic.dimension.pcaspatiomic.dimension.somspatiomic.dimension.tsnespatiomic.dimension.umapspatiomic.process.clipspatiomic.process.log1pspatiomic.process.normalizespatiomic.process.zscore
Use with scverse tools
[11]:
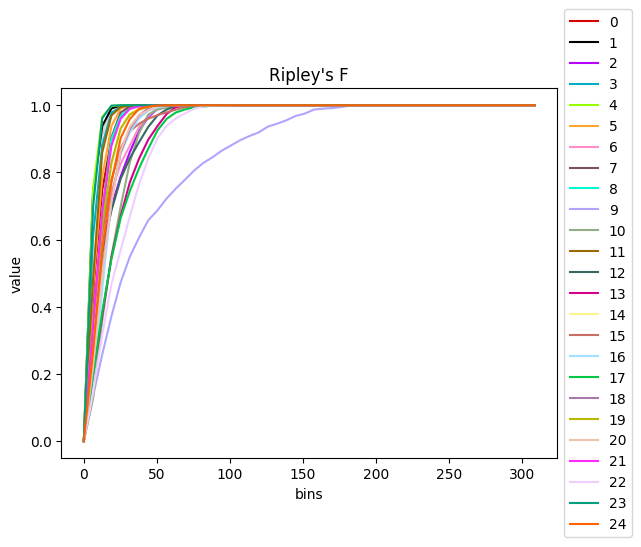
sq.gr.ripley(adata, cluster_key="clusters")
sq.pl.ripley(
    adata,
    cluster_key="clusters",
    palette=adata.uns["cluster_colors"],
)
[12]:
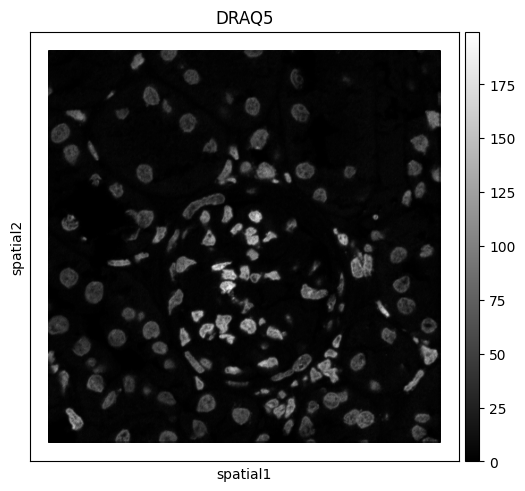
sq.pl.spatial_scatter(adata, color="DRAQ5", size=1, shape=None, cmap="gray")
WARNING: Please specify a valid `library_id` or set it permanently in `adata.uns['spatial']`
[13]:
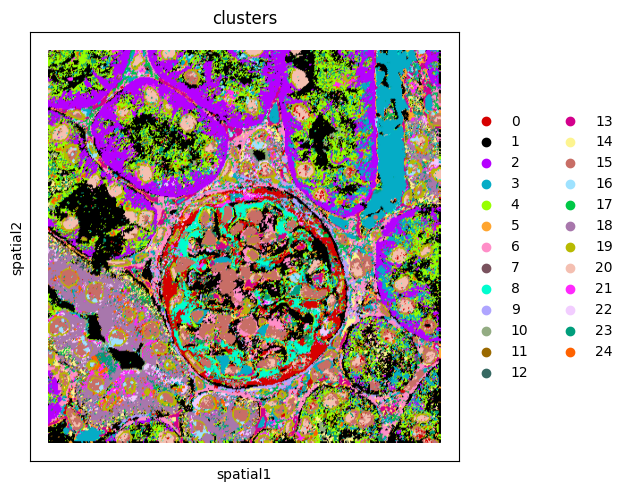
sq.pl.spatial_scatter(adata, color="clusters", size=1, shape=None, palette=adata.uns["cluster_colors"])
WARNING: Please specify a valid `library_id` or set it permanently in `adata.uns['spatial']`
[ ]: